I. Giới thiệu
K-Means Clustering là một thuật toán thuộc loại unsupervised learning, một trong những thuật toán đơn giản và phổ biến nhất trong Machine Learning, được dùng trong bài toán phân cụm dữ liệu. Tuy nhiên, nó vẫn có một vài hạn chế nhất định. Một trong số đó là Kmeans thường chỉ phù hợp với cluster có dạng hình tròn. Nếu cluster có dạng hình elip dẹt và khi sử dụng Kmeans để phân cụm thì cho kết quả khá tệ. Lúc này thuật toán Gaussian Mixture sẽ phát huy tác dụng của nó. Nếu Kmeans là thuật toán phân cụm dựa trên khoảng cách thì Gaussian Mixture lại dựa trên phân phối xác suất. Thực chất, Kmeans chỉ là một trường hợp cụ thể của Gaussian Mixture. Thuật toán Kmeans chỉ cập nhật giá trị trung bình. Trong khi đó, Gaussian Mixture cập nhật cả trung bình và phương sai. Tiếp theo ta sẽ cùng tìm hiểu kĩ hơn về thuật toán này.
II. Gaussian Mixture Model
1. Mixture Model
- Mixture model được dùng để mô tả phân phối xác suất
bởi các tổ hợp lồi (convex combination) của
phân phối xác suất
trong đólà các phân phối xác suất cơ bản như Gaussians, Bernoullis, Gammas,… và
là các mixture weights.
2. Gaussian Mixture Model
- Một Gaussian Mixture Model là một kết hợp của
Gaussian distributions
sao cho
trong đólà tập hợp tất cả các parameters của model.

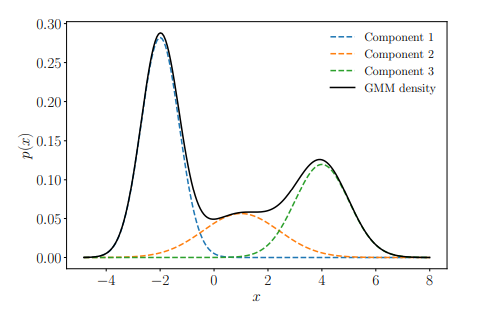
Hình 1: Ví dụ Gaussian Mixture Model
Giả sử ta có tập dữ liệu trong đó
,
được xây dựng từ phân phối xác suất
chưa biết. Mục tiêu của ta là tìm một xấp xỉ (approximation) tốt của
bằng GMM với
mixture components. Các parameters của GMM là
vector kỳ vọng
, ma trận hiệp phương sai
và mixture weights
. Ta kí hiệu
Ta sẽ đi tìm bằng Maximum Likelihood Estimation (MLE).
Likelihood của dữ liệu:
với mỗi thành phần là Gaussian mixture density.
Ta có log-likelihood:
Mục tiêu của ta là tìm bằng cách maximize log-likehood
. Một cách tự nhiên nhất là lấy đạo hàm
, cho bằng
và giải tìm
. Tuy nhiên, không như các lời giải maximum likelihood estimation cho Linear Regression, hay phân phối Gaussian, Bernoulli, ta không thể thu được dạng closed-form solution. Ta sẽ dùng thuật toán EM (Expectation Maximization, đã trình bày ở bài trước) cho GMM.
Remark: Một phân phối Gaussian nhiều chiều (Multivariate Gaussian) được định nghĩa bởi công thức:
với
Khi đó ta có:
Ta tính đạo hàm của hàm log-likelihood ứng với các tham số của GMM
Dễ thấy rằng
với là model parameters và
Sau đây ta sẽ lần lượt tính 3 phương trình đạo hàm ở trên.
Trước tiên ta có một khái niệm: Responsibilities
Responsibilities
Ta định nghĩa đại lượng
là responsibility của miture component thứ của điểm dữ liệu
.
Ta có là probability vector,
và
. Nếu
lớn có nghĩa là tỉ lệ điểm dữ liệu
được assign vào component thứ
lớn.
a) Updating the Means
Định lý 1 (Update of the GMM Means). Update của GMM Means được cho bởi công thức:
trong đó được định nghĩa ở trên.
Chứng minh:
Ta có:
Từ đó ta có:
Ta giải phương trình
với
b) Updating the Covariances
Định lý 2 (Updates of the GMM Covariances). Update của ma trận hiệp phương sai
của GMM được cho bởi
trong đó và
đã được định nghĩa ở trên.
Chứng minh
Ta có:
Mặt khác ta có:
Từ đây ta suy ra được
Khi đó
Giải phương trình đạo hàm bằng
Cuối cùng ta thu được
c) Updating the Mixture Weights
Định lý 3 (Update of the GMM Mixture Weights). Các mixture weights của GMM model được cập nhật bởi
với là số điểm dữ liệu và
đã được định nghĩa ở trên.
Chứng minh
Đây là một bài toán tối ưu có ràng buộc
Ta sẽ sử dụng phương pháp nhân tử Lagrange.
The Lagrangian is
Khi đó ta có
và
Giải phương trình đạo hàm bằng 0
Vậy
Ta sẽ sử dụng thuật toán EM để tìm
Đầu tiên ta sẽ init value cho và lặp thuật toán cho đến khi hội tụ.
- E-step: Evaluate the responsibilities
(posterior probability of data point n belonging to mixture component
).
- M-step: Use the updated responsibilities to reestimate the parameters
Tóm tắt thuật toán như sau:
3. Cài đặt với Python
a) Import các thư viện cần thiết
import numpy as np
import matplotlib.pyplot as plt
from scipy.stats import multivariate_normal
%matplotlib inline
b) Generate data
def generate_data(num_data, means, covariances, weights):
    """ Creates a list of data points """
    num_clusters = len(weights)
    data = []
    for i in range(num_data):
        #  Use np.random.choice and weights to pick a cluster id greater than or equal to 0 and less than num_clusters.
        k = np.random.choice(len(weights), 1, p=weights)[0]

        # Use np.random.multivariate_normal to create data from this cluster
        x = np.random.multivariate_normal(means[k], covariances[k])

        data.append(x)
    return data
# Model parameters
init_means = [
    [5, 0], # mean of cluster 1
    [1, 1], # mean of cluster 2
    [0, 5]  # mean of cluster 3
]
init_covariances = [
    [[.5, 0.], [0, .5]], # covariance of cluster 1
    [[.92, .38], [.38, .91]], # covariance of cluster 2
    [[.5, 0.], [0, .5]]  # covariance of cluster 3
]
init_weights = [1/4., 1/2., 1/4.]  # weights of each cluster

# Generate data
np.random.seed(4)
data = generate_data(400, init_means, init_covariances, init_weights)
#Visualize dữ liệu
plt.figure()
d = np.vstack(data)
plt.plot(d[:,0], d[:,1],'ko')
plt.rcParams.update({'font.size':16})
plt.tight_layout()
c) Cài đặt GMM
#Tính log-likelihood của dữ liệu
def log_sum_exp(Z):
    """ Compute log(\sum_i exp(Z_i)) for some array Z."""
    return np.max(Z) + np.log(np.sum(np.exp(Z - np.max(Z))))

def loglikelihood(data, weights, means, covs):
    """ Compute the loglikelihood of the data for a Gaussian mixture model with the given parameters. """
    num_clusters = len(means)
    num_dim = len(data[0])

    ll = 0
    for d in data:
        Z = np.zeros(num_clusters)
        for k in range(num_clusters):

            # Compute (x-mu)^T * Sigma^{-1} * (x-mu)
            delta = np.array(d) - means[k]
            exponent_term = np.dot(delta.T, np.dot(np.linalg.inv(covs[k]), delta))

            # Compute loglikelihood contribution for this data point and this cluster
            Z[k] += np.log(weights[k])
            Z[k] -= 1/2. * (num_dim * np.log(2*np.pi) + np.log(np.linalg.det(covs[k])) + exponent_term)

        # Increment loglikelihood contribution of this data point across all clusters
        ll += log_sum_exp(Z)

    return ll
#Thuật toán EM
def EM(data, init_means, init_covariances, init_weights, maxiter=1000, thresh=1e-4):

    # Make copies of initial parameters, which we will update during each iteration
    means = init_means[:]
    covariances = init_covariances[:]
    weights = init_weights[:]

    # Infer dimensions of dataset and the number of clusters
    num_data = len(data)
    num_dim = len(data[0])
    num_clusters = len(means)

    # Initialize some useful variables
    resp = np.zeros((num_data, num_clusters))
    ll = loglikelihood(data, weights, means, covariances)
    ll_trace = [ll]

    for i in range(maxiter):
        if i % 5 == 0:
            print("Iteration %s" % i)

        # E-step: compute responsibilities
        # Update resp matrix so that resp[j, k] is the responsibility of cluster k for data point j.
        # Hint: To compute likelihood of seeing data point j given cluster k, use multivariate_normal.pdf.
        for j in range(num_data):
            for k in range(num_clusters):
                resp[j, k] =  weights[k] * multivariate_normal.pdf(data[j], mean=means[k], cov=covariances[k])
        row_sums = resp.sum(axis=1)[:, np.newaxis]
        resp = resp / row_sums # normalize over all possible cluster assignments

        # M-step
        # Compute the total responsibility assigned to each cluster, which will be useful when
        # implementing M-steps below. In the lectures this is called N^{soft}
        counts = np.sum(resp, axis=0)

        for k in range(num_clusters):

            # Update the weight for cluster k using the M-step update rule for the cluster weight, \hat{\pi}_k.
            weights[k] = counts[k]

            # Update means for cluster k using the M-step update rule for the mean variables.
            # This will assign the variable means[k] to be our estimate for \hat{\mu}_k.

            weighted_sum = 0
            for j in range(num_data):
                weighted_sum += data[j] * resp[j,k]
            means[k] = weighted_sum / weights[k]

            # Update covariances for cluster k using the M-step update rule for covariance variables.
            # This will assign the variable covariances[k] to be the estimate for \hat{\Sigma}_k.
            weighted_sum = np.zeros((num_dim, num_dim))
            for j in range(num_data):
                #(Hint: Use np.outer on the data[j] and this cluster's mean)
                weighted_sum += np.outer(data[j] - means[k],data[j] - means[k]) * resp[j,k]

            covariances[k] = weighted_sum / weights[k]


        # Compute the loglikelihood at this iteration
        ll_latest = loglikelihood(data, weights, means, covariances)
        ll_trace.append(ll_latest)

        # Check for convergence in log-likelihood and store
        if (ll_latest - ll) < thresh and ll_latest > -np.inf:
            break
        ll = ll_latest

    if i % 5 != 0:
        print("Iteration %s" % i)
    weights = weights / sum(weights)
    out = {'weights': weights, 'means': means, 'covs': covariances, 'loglik': ll_trace, 'resp': resp}

    return out
np.random.seed(4)

# Initialization of parameters
chosen = np.random.choice(len(data), 3, replace=False)
initial_means = [data[x] for x in chosen]
initial_covs = [np.cov(data, rowvar=0)] * 3
initial_weights = [1/3.] * 3
# Run EM
results = EM(data, initial_means, initial_covs, initial_weights)
results['weights']
results['means']
results['covs'][0]
results['covs'][1]
results['covs'][2]
def bivariate_normal(X, Y, sigmax=1.0, sigmay=1.0,
                 mux=0.0, muy=0.0, sigmaxy=0.0):
    """
    Bivariate Gaussian distribution for equal shape *X*, *Y*.
    See `bivariate normal
    <http://mathworld.wolfram.com/BivariateNormalDistribution.html>`_
    at mathworld.
    """
    Xmu = X-mux
    Ymu = Y-muy

    rho = sigmaxy/(sigmax*sigmay)
    z = Xmu**2/sigmax**2 + Ymu**2/sigmay**2 - 2*rho*Xmu*Ymu/(sigmax*sigmay)
    denom = 2*np.pi*sigmax*sigmay*np.sqrt(1-rho**2)
    return np.exp(-z/(2*(1-rho**2))) / denom
import matplotlib.mlab as mlab
def plot_contours(data, means, covs, title):
    plt.figure()
    plt.plot([x[0] for x in data], [y[1] for y in data],'ko') # data

    delta = 0.025
    k = len(means)
    x = np.arange(-2.0, 7.0, delta)
    y = np.arange(-2.0, 7.0, delta)
    X, Y = np.meshgrid(x, y)
    col = ['green', 'red', 'indigo']
    for i in range(k):
        mean = means[i]
        cov = covs[i]
        sigmax = np.sqrt(cov[0][0])
        sigmay = np.sqrt(cov[1][1])
        sigmaxy = cov[0][1]/(sigmax*sigmay)
        Z = bivariate_normal(X, Y, sigmax, sigmay, mean[0], mean[1], sigmaxy)
        plt.contour(X, Y, Z, colors = col[i])
        plt.title(title)
    plt.rcParams.update({'font.size':16})
    plt.tight_layout()
# Parameters after initialization
plot_contours(data, initial_means, initial_covs, 'Initial clusters')
# Parameters after running EM to convergence
results = EM(data, initial_means, initial_covs, initial_weights)
plot_contours(data, results['means'], results['covs'], 'Final clusters')
III. Tài liệu tham khảo
- Book Mathematics for Machine Learning, by Marc Peter Deisenroth, A. Aldo Faisal, and Cheng Soon Ong.
- https://www.cs.cmu.edu/~epxing/Class/10701-08s/recitation/gaussian.pdf


